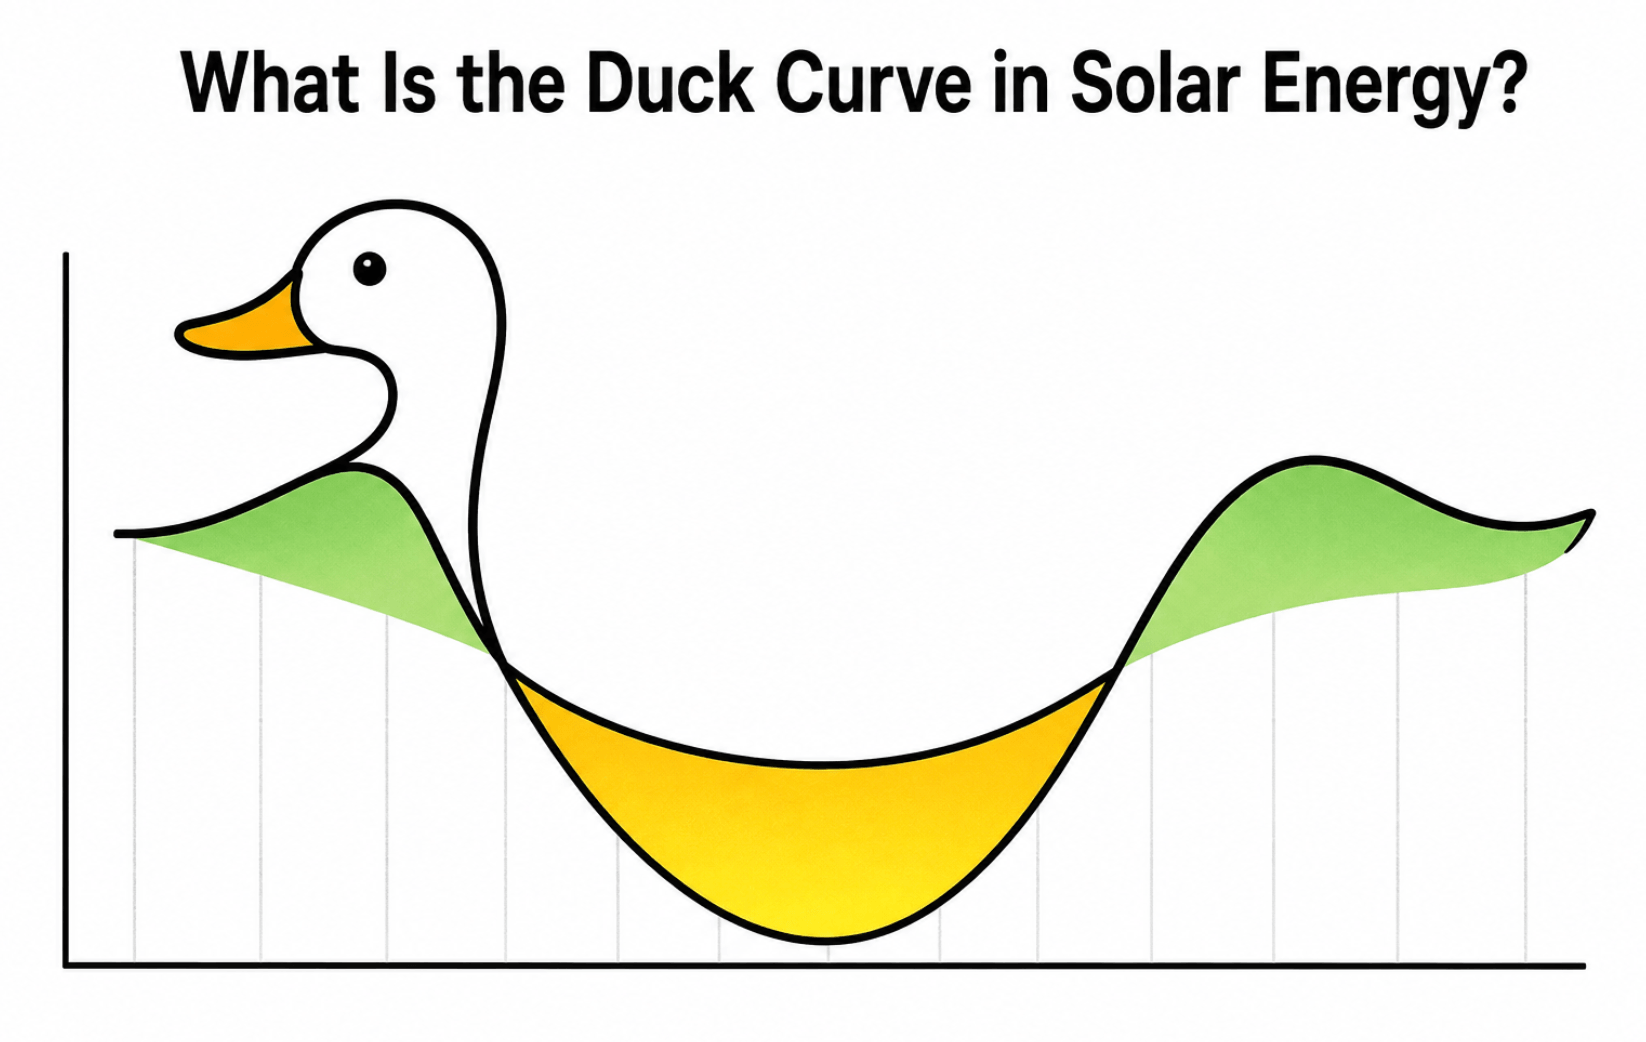
If you’ve ever looked at a grid operator’s daily electricity demand chart and thought it looked oddly like a cartoon duck, you weren’t imagining things.
That’s exactly where the name comes from, and understanding this “duck curve” is one of the fastest ways to understand why solar power, for all its benefits, creates a very specific headache for the electric grid.
As a certified solar technician, I get asked about this a lot by homeowners trying to understand why their utility offers time-of-use rates that penalize evening electricity use. The duck curve is the answer.
What Is the Duck Curve in Solar Energy?
The duck curve is a graph of net electricity demand (total demand minus the power supplied by solar) plotted over a 24-hour day.
It shows how much power the grid’s traditional generators (natural gas, coal, hydro, nuclear) need to supply once solar output is subtracted out.
The graph gets its name because its shape resembles a duck: a high “head” and “tail” at the edges of the day, a deep “belly” dip in the middle of the day, and a steep “neck” as evening approaches.
The term was coined around 2012–2013 by engineers at the California Independent System Operator (CAISO), which manages most of California’s power grid, the first grid in the U.S. to see this pattern emerge at scale as rooftop and utility-scale solar adoption grew rapidly.
The Four Parts of the Duck’s Shape
To understand why the curve matters, it helps to walk through each section of the “duck” in order.
The Morning Ramp-Up (Early Head)
As people wake up, start appliances, and businesses open, demand for grid electricity rises. Solar output is still low or zero because the sun has barely risen.
The Midday Belly (Solar Overproduction)
Between roughly 10 a.m. and 3 p.m., solar panels, both rooftop and utility-scale, are producing at or near peak output.
Because so much of that power comes from solar, the amount of electricity that traditional power plants need to supply drops sharply, sometimes to very low levels. This is the “belly” of the duck.
On days with exceptionally high solar output and mild weather (so air conditioning demand is low), the belly can dip low enough that grid operators have to actively curtail, deliberately shut off, or throttle solar generation to avoid overloading the grid.
The Evening Neck (Steep Ramp)
This is the part of the curve that worries grid operators most. As the sun sets in the late afternoon, solar output falls off quickly, but human electricity demand is doing the opposite: people are getting home, turning on lights, cooking dinner, and running air conditioning or heating.
Traditional power plants have to ramp up output extremely fast, sometimes needing thousands of megawatts of new capacity within just a couple of hours.
The Evening Peak (Head/Tail)
Demand stays elevated into the evening before gradually tapering off overnight as people go to sleep.
Why the Duck Curve Is a Problem
The duck curve isn’t just a curiosity. It creates real technical and economic challenges for utilities and grid operators.
Steep ramping requirements
Power plants that can start up and shut down quickly (called “peaker plants,” usually natural gas) are needed to cover the evening neck. These plants are often less efficient and more expensive to run than baseload plants.
Overgeneration and curtailment risk
During the midday belly, there can be more solar power available than the grid can use, forcing operators to waste (curtail) clean energy that was already generated.
Grid stability concerns
Rapid swings in net demand put stress on transmission infrastructure and require careful frequency and voltage management.
Economic pressure on solar
When solar floods the market at midday, wholesale electricity prices during those hours can fall very low, sometimes negative.
That reduces the revenue solar plant owners earn for midday power, which is part of why battery storage is becoming essential to solar project economics.
Time-of-use rate design
Utilities increasingly charge more for electricity used in the early evening (often 4–9 p.m.) specifically because that’s when the duck’s neck strains the system.
This is why many time-of-use plans now reward off-peak or midday use rather than the traditional evening peak.
How the Duck Curve Is Being Flattened
The good news is that the duck curve isn’t a permanent flaw in solar power. It’s a signal pointing directly at the solution: storage and demand flexibility.
| Solution | How It Helps |
|---|---|
| Battery energy storage | Charges during the midday belly when solar is abundant and cheap, discharges during the evening neck when demand is high |
| West-facing solar panels | Shift a portion of a system’s peak output later into the afternoon, softening the ramp |
| Demand response programs | Pay or incentivize customers to shift usage (EV charging, water heating, laundry) into midday hours |
| Time-of-use and export rates | Price signals that reward charging batteries or using power during the solar-rich midday window |
| Grid-scale storage buildout | Utilities are rapidly adding large battery installations specifically to absorb midday solar and discharge in the evening |
In California, large-scale battery storage has already made a measurable dent in the evening peak, with batteries now regularly supplying a significant share of early-evening demand that used to come almost entirely from gas plants.
What the Duck Curve Means for Your Home Solar System
If you’re considering solar for your home, the duck curve has a few practical implications:
A solar-only system without storage may earn you less for excess power
If your utility uses net billing tied to real-time wholesale value (instead of flat net metering), the power your panels export at midday is worth less than power used in the evening.
Battery storage is increasingly the better long-term play
Storing your own midday solar and using it during the evening peak avoids buying expensive peak-hour power and avoids exporting into an oversupplied midday market.
System orientation matters more than it used to
A designer may recommend some west-facing panels specifically to extend your production later into the afternoon, even though south-facing panels alone would produce more total energy.
Rate plans are shifting
Expect more utilities to move toward rate structures that reflect the duck curve. Cheaper midday power and more expensive early-evening power, so understanding your utility’s time-of-use schedule is worth doing before you finalize a system design.
Frequently Asked Questions
Why is it called a duck curve?
The graph’s shape a rounded head in the morning, a deep dip at midday, and a tall, steep neck in the evening. Resembles the silhouette of a duck. The term was popularized by CAISO around 2012–2013.
Is the duck curve only a California problem?
No. It was first identified in California because that grid had the earliest high penetration of solar, but the same pattern now shows up on grids in Hawaii, Australia, parts of Europe, and increasingly across the U.S. Southwest and other high-solar regions as adoption grows.
Does the duck curve mean solar power is a bad idea?
No. It means solar’s value shifts over the course of the day as more of it comes online. Pairing solar with battery storage, at both the grid and household levels, largely solves the problem while preserving solar’s cost and environmental advantages.
Can home battery storage really help with the duck curve?
Yes. Every home battery that charges from midday solar and discharges in the evening reduces both the midday oversupply and the evening ramp, the same principle utilities use at grid scale, just applied at the household level.
What is curtailment, and how does it relate to the duck curve?
Curtailment is when grid operators deliberately reduce solar output because there’s more supply than the grid can use, most common during the duck curve’s midday belly.
It represents clean energy that’s generated but not used, which is a key reason storage buildout is accelerating.
Seki Hudson is an ANCE-certified solar technician and industrial automation engineer writing about solar energy systems, design, and the technology behind the modern grid.
